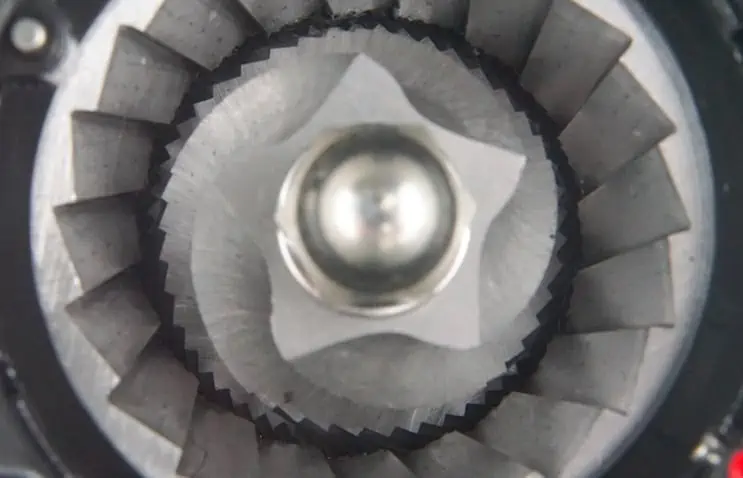
Closeup of coffee grinder burrs. Photo by Howard Bryman.
There were a number of ways we could have approached the evaluation of the four grinders reviewed this month with regard to producing consistent particle size. We could have judged the machines based on the results of brewing with the grounds they put out, or simply through visual inspection of the grounds, or by manually sieving each sample to separate particles by size.
Instead, we decided to send samples of coffee ground by each machine to our friends at the Horiba Instruments particle science lab in Irvine, California, for particle size distribution analysis using laser diffraction equipment, because that appeared to represent the clearest, most objective route to evaluating the grind consistency of the four machines reviewed in this report.
Yet even with that decision made, there remained a number of ways we could have gone about selecting the samples, as well as various ways to approach the resulting data. Here’s what we did, and why.
Settings vs. Brew Methods
First, we decided not to get too bogged down in the particular requirements of specific brew methods, as these can be quite subjective as well as influenced by complex, interacting variables — brew water temperature, darkness of roast, green coffee character, filter material and construction, etc.
We did consult the settings for various brewing methods recommended by the instruction manuals provided by each grinder-maker. We also consulted material on grind size produced by the KRUVE company, which produces a set of sieves for isolating a specific micron range of coffee particles for more refined brewing. (KRUVE recommends you toss out the particles that are too large or too fine for optimal brewing.)
The instructions provided by grinder manufacturers could suggest a starting point for an optimal range of particle size, but they are simply too vague and are often specific to the performance of one machine. If anything, they lean toward recommendations coarser than used by many professionals and aficionados for most brewing methods. This may be because manufacturers predict a coarser setting on their machines will result in fewer fines that clog up a filter or flat-out stop a brewing act; the trade-off being that while a coarser setting may produce a weaker, more listless cup, at least the consumer will get a cup.
The KRUVE recommendations for specific brewing methods, meanwhile, present an impossible ideal for a grinder, veering substantially finer than the norm because the KRUVE system eliminates the very fine particles that other brew guides assume you’re brewing with.
What’s universally true, though, is that a more consistent particle size makes for better brewing, no matter how you brew. So we decided to evaluate grinders based simply on the consistency of the particle size they produce, regardless of the brewing method to which that particle size is best suited.
Choosing the Sample Settings
So without focusing on brewing method, and without straining the grinders to their extremes of either coarseness or fineness, we simply twisted the dials and knobs on each grinder to produce: 1) a sample at one or two notches finer than the coarsest setting on the grinder; 2) a sample one or two notches coarser than the finest setting, and 3) a sample at the center setting. We did this with a light (but not aggressively light) roasted coffee, and a darker roasted coffee (just nudging into second crack but not too far into it). This netted us a total of six grind samples from each machine, ranging from what the grinder setting proposed as fine through medium to coarse, in each case tested at two different roast levels.
Note that we are not proposing that any of these particle size ranges is any more appropriate to any given brewing method than any other range. All we wanted to know was to what degree each grinder generated a consistent grind size at various settings, and to what degree it did not.
“Generally Optimal Range”
This is where our friends at Horiba really helped us out. Horiba provided mountains of data, packaged into a wide variety of stats and calculations. They provided wavy-lined graphs that gave form to the vast range of particle sizes. They identified and charted for each sample the mean, median and mode particle sizes, the standard deviations, coefficients of variation and so on. Particle size distribution analysis has application in a huge variety of fields, from pharmaceuticals to ceramics, construction to food & beverage, and yet no one had ever collaborated with them on a comparative analysis of particles generated by coffee grinding machines amid the quest for a better cup of coffee.
In the end, we had to ask ourselves: At what point does variation in particle size become detrimental to brew quality? Given that absolute uniformity is impossible, just how tight a range do we really need? Even the Specialty Coffee Association’s official Cupping Protocol is stunningly generous in this regard: It only requires that the grind for cupping be of a particle size of which 70-75% passes through the standard #20 mesh sieve (with holes of 841-micron diameter). That’s an acceptance of 25-30% oversized particles with no limit at all for undersized.
The 400-Micron Window
Extraction scientists could perhaps provide an answer to our question, but have not, at least so far as we can tell. We do know that the need for consistent particle size is different for different brew methods; for example, the window for acceptable consistency is much slimmer for espresso than for drip.
We also know that KRUVE established its grind size recommendations based on their own research of coffee extraction times in relation to the water-to-coffee contact time, pressure and temperature. For most methods, the ranges they recommend are in windows 400 microns wide. So, somewhat arbitrarily, we decided to adopt a 400-micron window as the basis for our evaluations.
With Horiba’s help, for each sample we zeroed in on the mode particle size, meaning the particle size that occurs most prevalently within a given sample. We then set boundaries 200 microns larger and 200 microns finer, creating a 400-micron range with the mode size at its center. We then calculated what percentage of each sample landed within that range, and used that key metric to compare grind consistency among samples and grinders.
Particles that measured larger than the 400-micron window we called “coarser.” Finer than that window “finer.” Particles that fell inside the 400-micron window we called “optimal.”
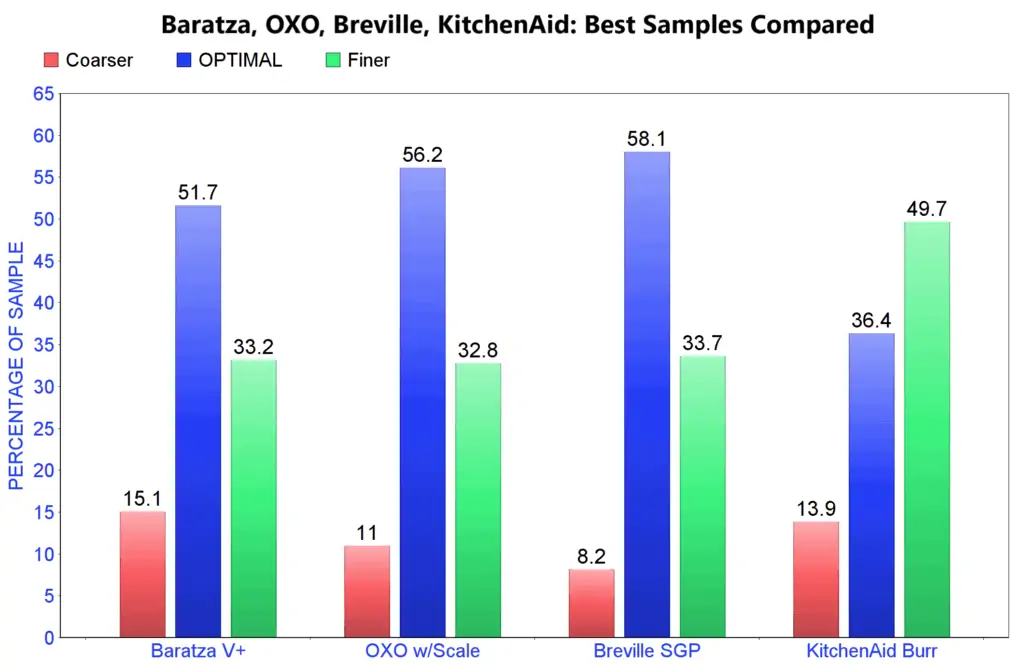
See the graph below for a look at how the four reviewed machines compared when tested using the metric of the 400-micron window. You can find similar graphs with more detailed results for each grinder in the separate reviews of those grinders: the Baratza Virtuoso+, the Breville Smart Grinder Pro, the KitchenAid Burr Grinder, and the Oxo Conical Burr Grinder With Integrated Scale.

Summary grind consistency test results based on laser particle size distribution analysis by Horiba Instruments for the four grinders reviewed for this report. Six samples were tested from each grinder representing various grind settings (coarse, medium, fine) and two degrees of roast (light and medium-dark). Shown here are results for the best-performing sample among the six produced by each grinder. The blue column represents the percentage of the sample reduced to a range of particle sizes we identified as optimal; the red column the percentages produced coarser than optimal, and the green finer than optimal. For an explanation of how we determined our optimal range of particle sizes see earlier in this article.
A Note of Thanks
We would like to extend a special thanks to the extraordinarily helpful team we worked with at the Horiba particle size analysis lab in Irvine, California, including Horiba Vice President Mike Pohl, Applications Lab Supervisor Amy Hou, and Particle Science Liaison Julie Chen Nguyen. Over the course of several weeks, multiple conversations and long email chains, they made some pretty complex concepts much easier to understand and shed light on possible approaches to data they gathered using their Horiba Partica LA-960V2 Laser Scattering Particle Size Distribution Analyzer. Those readers interested in the application of particle science to coffee can learn more about it here. The Horiba team’s flexibility and assistance has been invaluable to our goal to help consumers make better and more informed buying decisions, and we hope to continue this partnership long into the future.
And, special thanks as well to the generous Portland roasters who contributed beans for use in our grinder tests: Coava Coffee Roasters, Nossa Familia Coffee and Torch Coffee Roasters.


